The Dashboard section is the default landing page when logging into the Client Portal, providing instant access to key information, organized into 3 main sections.
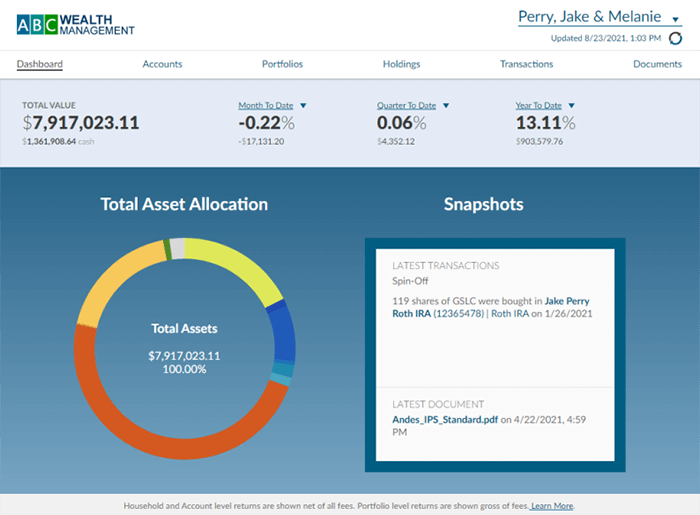
Value/Performance Summary: The ribbon on the top of home page details out the total market value for all of your accounts as well as the total cash value. The section then provides a series of 3 performance figures: Month to Date, Quarter to Date, and Year to Date returns (expressed in both percentage and dollar amount). Clicking on the arrow next to any of these performance figures will allow you to select a different time period, the options of which are as follows: Last Year, Year to Date, Month to Date, Quarter to Date, Last Quarter, Last Month, Annualized and Since Inception.

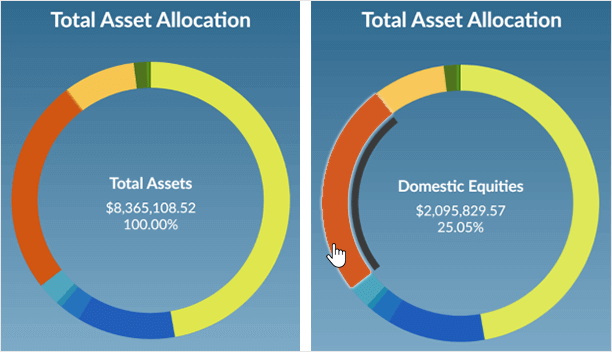
Total Asset Allocation: This chart provides a breakdown of the asset classes represented at the household level, adding together all your accounts, allowing you to quickly see how your money is distributed across asset classes. This chart is interactive, allowing you to hover over any asset class to view the dollar amount and percentage that is allocated to that particular asset class.
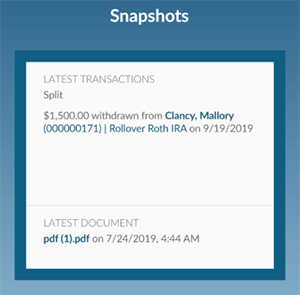
Snapshots: This section provides the most recent transaction activity and documents that have been added to your Client Portal. Clicking on the hyperlinks within this section will direct you to the applicable information.